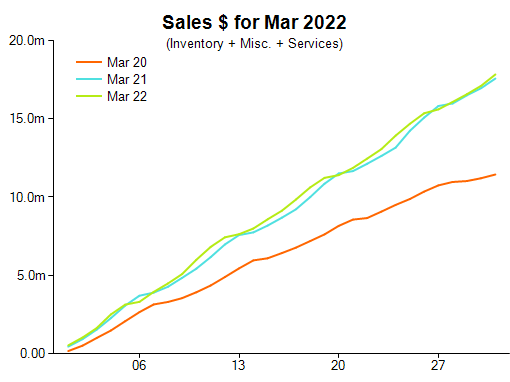
Data collected from 1 March through 31 March shows that comparative overall sales dollars increased by 1.5 per cent compared with the same period last year, and while there was a huge 56 per cent increase compared with March in 2020.
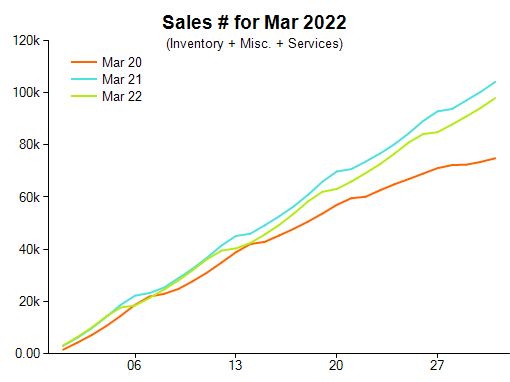
The comparative units sold show a decrease of 6 percent compared with March 2021 but a strong 31 per cent increase compared with March 2020.
According to Retail Edge sales manager Michael Dyer, one potential explanation for this drop in units sold could be widespread weather conditions on the east coast of Australia.
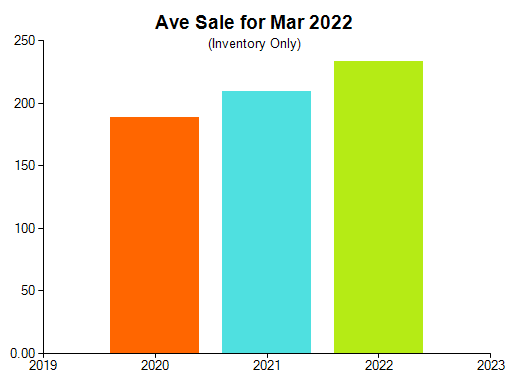
The comparative inventory average sale continues to climb and was 11 per cent higher compared with March 2021, rising from $209 to $233. Compared with March of 2020, that was an increase of 24 per cent.
Product categories show positive signs
There was notable increases across many of the product categories. Diamond set precious metal jewellery was up 2.5 per cent compared with March last year and a remarkable 76 per cent on the same period in 2020.
Colour stone set precious metal jewellery sales dollars increased 30 per cent compared with March 2021 and showed an even larger increase of 66 per cent on the two-year comparison with March 2020.
Non-stone precious metal jewellery sales dollars increased strongly again, to be 18 per cent higher compared with March 2021 and it was an exceptional result of 21 per cent growth on the two-year difference with March 2020.
Silver and alternative metals jewellery sales dollars increased 17 per cent compared with March 2021 and were 53 per cent higher on the two-year comparison with March 2020.
Dyer believes that the above trends continues to suggest a strong positive consumer mindset and that gathering higher quality data was crucial.
“I believe it is so important for getting the best picture of what is happening,” Dyer said said.
“[Retailers] need to make sure that their custom makes, diamond set or coloured stone set, are getting allocated stock numbers and being recorded as sales in a product category so that the value of the information can be easily seen, rather than being lost in your repairs.
“I can't emphasise this enough. The quality of the data has a strong influence on the visibility of patterns.”
The pattern with layby purchases showed an increase of 13.6 per cent in dollars between new items and pick-ups or cancellations. This demonstrates good cashflow pattern in the pipeline.
Interestingly, the pattern in services and repairs is the reverse outcome with a decrease of more than 12 per cent witnessed between incoming orders and pick-ups or cancellations.
“That's not bad news,” advised Dyer.
“It just means that the repairs are being completed and collected. The special order numbers show a similar pattern with a decrease of 10.3 per cent between incoming orders and pickups or cancellations. Again that's not bad news.”
Retail Edge’s data is gathered from its POS software located more than 400 Australian independent retail jewellery stores. It is intended to present a representative sample of the wider Australian jewellery industry.
2022 Jewellery Retail Sales March Results
Charts published with permission courtesy of Retail Edge
The charts below are based on data collected via Retail Edge POS software
at more than 400 independent Australian jewellery stores.


More reading
February jewellery sales remains strong after the holiday rush
December jewellery sales still upward despite drop in volume
Consumer demand for jewellery seen to drive strong December trading